Harnessing the Power of Heatmaps to Improve Marketing
By Sakshi Arora
Nov 11, 202110 min read
Do you remember back when we collected magazines, and we sat around pretending to read, but actually, we were just flipping through and hopping from picture to picture? Looks like things are still the same! Now, instead of magazines, we have online content, where we scan through the entire page instead of reading.
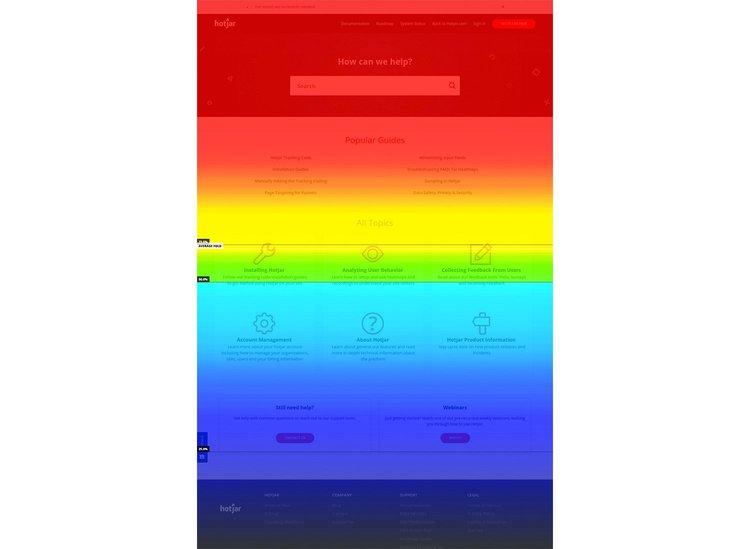
Check these heatmaps; these can provide insights on whether a reader is actually going through all of your text or are they just scrolling horizontally and vertically.
Source: https://www.searchenginejournal.com/use-heatmaps-seo-strategy/366268/#close
Heatmaps have been one of the popular conversion tools for a reason. They are highly efficient and cost-effective, providing the pain points that work well for your website and help in understanding your prospects.
What are Heatmaps?
Heatmaps are a visual representation of your data or the form in which your target audience is interacting with your digital content. Heatmaps came into existence to display real-time financial data to stakeholders and traders so that they can make sound financial decisions.
To talk about marketing, the heatmaps allow monitoring, quantifying, and displaying web users’ clicks and trackpad movements.
To be concise, heatmaps are an effective marketing technique used to visualize users’ interactions with the digital elements and data available on the web. As a result, displaying real-time insights into how digital layouts, graphic elements, and user experience impacts their actions and conversions.
No matter in what context heatmaps are used, the one common thing about them is – the colors used for visual representation. The brighter the area, the better the user interactions.
In addition, the brighter areas are considered as the areas where the users first see and interact with your content.
Types of Heatmaps
1. Hover Maps
Hover maps, tracking your mouse movements!
Mostly when you hear heatmaps, it generally points towards hover maps. These types of maps show you the areas where the web users have hovered their mouse cursor.
The representation of hover maps is simple, the hotter or brighter the area, the longer the users have had their cursor on it. Gathering this data will help in determining visitors navigating through your website. Thus, to be more certain, you should add elements like location, to generate maximum attention.
Furthermore, hover maps let you fathom superfluous elements that distract your visitors from getting converted.
2. Click Maps
As the name indicates, click maps represent the aggregation of the clicked data.
The bright yellow/white color indicates the maximum clicks, followed by the red warmer color with average clicks, and at last, the blue color indicates the minimum clicks.
Several eCommerce web developers use click maps to ensure customers have a satisfactory shopping experience.
Click maps profusely deliver high interactive value, helping marketers to understand the significance of optimization. Furthermore, the maps also help in analyzing what is working the best and what is not.

Another way to depict the ideology of click maps is, the data represents if the visitors are clicking on your CTA button. Consequently, it also helps you to check if they get distracted by non-clickable elements.
Pair (now known as Couple) used a click map to check the distractions and frictions in their landing page.
3. Attention Maps
Attention maps are indeed an optimal choice for marketers to evaluate their performance.
By using the horizontal and vertical scrolling activity, as well as the time spent, attention maps depict the most and the least viewed areas by the visitors.
Considered the most useful type of heatmaps because of the attention to detail and from major to minor information. Attention maps help the designers to create and design web pages easily as it includes both text and visuals.
4. Scroll Maps
Scroll maps represent how far a user has scrolled down your webpage. Companies that focus on the long-form of web page content leverage scroll maps, as they are ideologically designed well for long pages.
The idea behind this was if the page is longer then only a few people will make it to its last. Scroll maps help you to prioritize your content depending on what you should have and what is unnecessary.

Scroll maps play an integral role in fine-tuning your designs. If it shows abrupt shade changes, this means people are unable to connect between the particular (area with different shades) elements, helping you to modify your page and content accordingly. Moreover, these drop-offs cannot be witnessed through tools like Google Analytics.
In addition, the longer landing pages should have navigation cues like upward or downward arrows, or page indexes with links to enrich users’ experience.
August Ash used scroll maps to later find that their visitors were not clicking on their CTAs.
Increase Conversion Rate with Heat Maps
Heatmaps help in generating massive information regarding the visitors on your webpage, also they provide the right insights regarding the browsing actions the users take.
Every marketer ensures to add CTA on their website, to ensure visitors click! So the perspective of every CTA is to make the users take an action, it can buy your product or service, subscribe to your channel, add to cart, etc.
Implementing techniques like heatmaps will help webmasters to know precisely about the website structure and design, in context to optimize it for accomplishing their end goal.
Key Pointers to Generate Conversions
- Heatmaps are the best way to find out how your visitors communicate with the clickable links or call to action.
- To make the best of the marketing efforts you need to have a thorough understanding of whether or not any friction points exist.
- You can check the areas your web visitors interact the most.
- You can also observe the page elements that hinder the customers to move towards the conversion path.
To convert you need to entice your visitors, and CTA is all about that. Thus, using heatmaps, you can easily gauge the efficacy of the CTA’s and tweak them either for design, placement, or action to maximize your conversion rates.
However, don’t rely on CTAs only. Not every customer converted is preceded by a CTA. Sometimes your sales copy can do the job.
By using heatmaps, you can check what your users have been up to, and which area they are focusing most on.
Harnessing the Power of Heat Maps to Improve Marketing
The marketing campaigns carried out hope for customers to convert, but without the right tools most marketers end up with the guessing work only.
As mentioned above, with heatmaps you can track your customers’ journey. Tools like Google Analytics are used to track clicks, conversions, page views, and downloads, however, these are not enough to understand customers’ behavior.
Your marketing efforts cannot be only rudimentary. With CTA you can surely know that your customers want to know more about your brand, but it won’t tell you which page or content drives them to take an action.
Intrigued?
Let’s walk through the strategies you can implement to improve marketing with heatmaps:
Boost Content Writing Efforts
As we talk about content writing efforts, it feels good to know the number of people engaged with your content. But how about you can know more like how much content is read? Are they even interested in your content? Do they read the first two lines and leave or do they read the full content?
With scroll maps, you can check how far your customers go while they are on your page. Scroll maps provide you with more insights on customer behavior, showing which content your users engage most with, which sections are most scrolled over without even taking a glance, or when they leave your webpage.
The data gathered through these heatmaps will help you to refine your website content.
Indeed we have several tools to help us understand what users think, with keyword master you can unearth keywords to create relevant content, ad copies, or sales pitches. Moreover, when you add heatmaps to your marketing strategy, you will have an understanding of what type of content your audience engages with.
Now you do not have to crumble yourself with questions like was your content relevant, was it difficult to read, have you addressed all the points, etc.
Heatmaps will direct you to the areas you need to focus more on, what type of content your audience is interested in, and at what point they drop off. Put this knowledge into the equation and improve your content.
Enhance SEO Efforts
To stay ahead of the curve, you need to understand how your web users interact with your website, content, design, structure, and on-page elements, allowing you to strategize your efforts to attract users to engage, connect, and ultimately convert.
Not all marketing efforts fall in place. So by adding heatmaps to your strategy, you can identify the issues that cause friction and delays in attracting new opportunities to generate traffic and drive conversions.
You can use heatmaps for:
- Learn more about user intent.
- Determining optimum content length.
- Improving outbound and internal linking strategy.
- Optimizing page layout.
- Recognizing areas and elements that cause friction.
- Understanding why consumers take the action (click, purchase, etc.).
You can add heatmaps along with other SEO tools to get a clearer picture of what the audience is looking for, and based on that craft your marketing strategies and efforts.
Understand Customer Behavior
Heatmaps paint a broader picture, making you more informed about your users’ actions and helping you to tweak your efforts to deliver a more refined user experience. Heatmaps deliver great customer insights and help to address problems with page design impeding customers from converting.
Web analytics tools are essential for you to find out how long users were on your website, but when you add heatmaps to your strategy, you can know at what point they left your site.
You can initiate by collecting customer data that represents your products being checked and clicked the most by your audience. With heatmaps, you can understand what your customers are attracted to most and what makes them lose their sight. The insights will help you in making an informed decision regarding your inventory, marketing efforts, and sales pitches.
Enrich User Experience
It is common knowledge to keep impressive and persuasive content and CTA at the top, as visitors hardly check the entire webpage. However, this is not always the case. With scroll maps, you can check whether or not the webpage visitors have scrolled through.
On the other hand, if your audience is staying above the fold, then most of them are likely to hover, maybe the areas that are different from where you are targeting. A hover map will help you access how users are navigating through your web page.
Therefore, with this information, you can optimize your web pages to make the user experience more satisfactory.
Wrapping Up
In the end, just like other web analytic tools, heat mapping is one of the most useful digital marketing tools to understand user behavior, improve marketing efforts, and generate conversions.
By implementing such tools, companies can easily find what might be bugging the audience that makes them bounce. Thus, gathering and analyzing this data will help you to refine your strategies and tailor them across a better user experience, which will eventually generate traffic and conversions.
The key to using heatmapping most effectively is by using it often, implementing the outcomes, and proceeding to test and optimize the strategies crafted.
In other words, heat mapping is a continuous process!


